Conversion optimisation workflow for e-commerce in 2026
TL;DR:
- A structured CRO process involves six core stages, from analytics audits to scaling winning experiments, ensuring continuous improvement. Accurate funnel analysis and disciplined testing, guided by frameworks like ICE or EPIC, help prioritize hypotheses effectively. Long-term success depends on data integrity, patience, and treating optimization as an ongoing systematic cycle.
A conversion optimisation workflow is a repeatable, data-driven process that e-commerce teams use to systematically improve the percentage of visitors who complete a desired action on their website. Known formally as CRO (conversion rate optimisation), this methodology moves well beyond guesswork. It combines analytics auditing, conversion funnel analysis, hypothesis building, A/B testing, and result scaling into a disciplined cycle. Tools like Google Analytics 4, Hotjar, and VWO are central to how high-performing teams execute this in 2026. Get the process right, and each completed test raises the baseline for the next, creating compounding gains over time.
What are the essential stages of a conversion optimisation workflow?
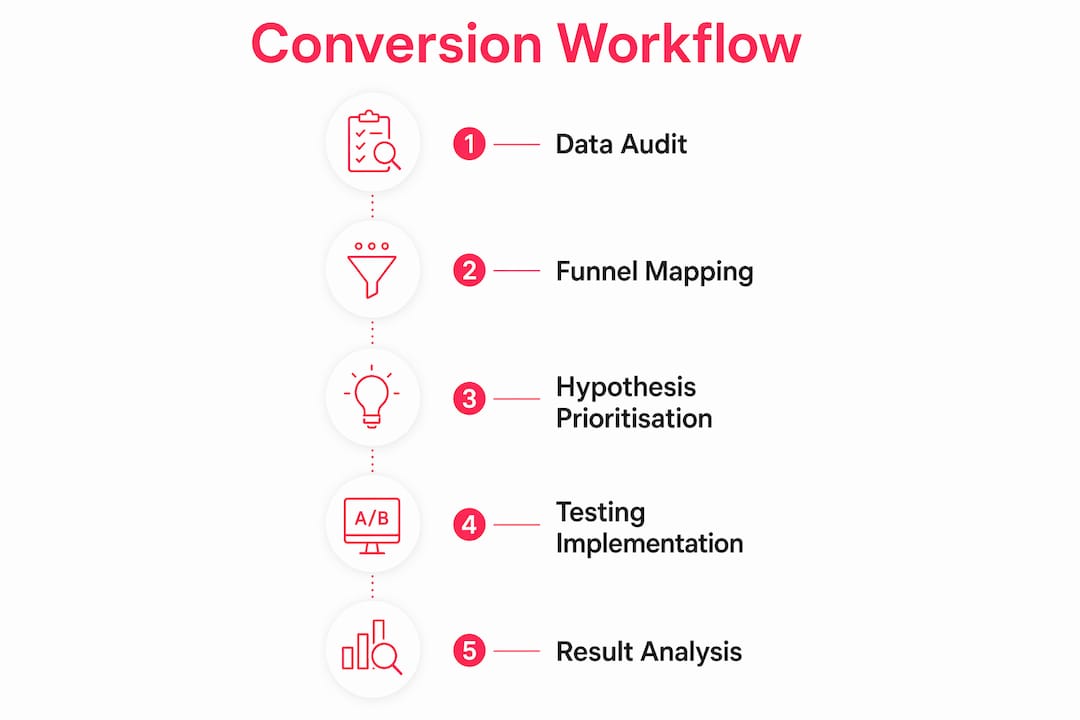
A structured CRO process follows six distinct stages, each building directly on the last. Skipping any one of them is where most teams go wrong.
-
Audit your analytics — Before you touch a single page element, validate your data. Most audits find material tracking errors, and optimising based on flawed data produces ineffective results. Check that Google Analytics 4 events fire correctly, that goals are configured accurately, and that your attribution model reflects real user behaviour.
-
Map your conversion funnel — Define each funnel stage based on actual user intent, not the idealised path you wish users would take. Mapping the funnel based on real user paths rather than assumed steps uncovers hidden drop-offs that would otherwise go undetected.
-
Build evidence-based hypotheses — Combine quantitative data (drop-off rates, bounce rates, session duration) with qualitative insights from Hotjar heatmaps and session recordings. Every hypothesis should follow a clear structure: “If we change X, we expect Y, because Z.”
-
Execute disciplined A/B tests — Calculate your required sample size before launching. Split traffic 50/50 for standard tests, or use a 10% ramp-up for higher-risk changes. QA every variant across devices before going live.
-
Analyse for statistical significance — Do not call a winner early. Reaching 95% confidence and completing at least one full business cycle is non-negotiable. Early peeking causes false positives that waste development resource.
-
Scale and document — Deploy winning variants with technical validation to preserve tracking integrity. Log every learning in a central repository so the team builds institutional knowledge over time.
Pro Tip: Teams running two to four tests per month consistently outperform those running one test per quarter. Velocity compounds. Prioritise shipping tests over perfecting them.
How to conduct accurate conversion funnel analysis
Conversion rate improvement is about tackling friction throughout the entire funnel, not just improving traffic or adding visual tweaks. Accurate funnel analysis is the diagnostic tool that tells you where to focus first.

Start by defining your funnel stages precisely. For a typical e-commerce store, this means: landing page, category page, product detail page, cart, checkout, and order confirmation. Each transition between stages is a potential drop-off point, and each deserves its own measurement.
Use server-side tracking to protect data accuracy against browser-level restrictions like ad blockers and iOS privacy changes. Client-side tracking alone is no longer sufficient in 2026. Server-side data forms the trustworthy foundation that all subsequent CRO decisions rest on.
Once your data is clean, segment your funnel by device type, traffic source, and user type (new versus returning). Successful CRO teams treat the funnel as a living diagnostic tool segmented in this way, because a drop-off that looks minor in aggregate can be catastrophic on mobile specifically.
Key friction points to investigate:
- Landing page to product page: Drop-off rates here can reach 40 to 60%, driven by weak value propositions, slow load times, or mismatched ad messaging. This is where most revenue is lost, not at checkout.
- Cart to checkout: Abandonment here is often caused by unexpected shipping costs, forced account creation, or a lack of trust signals.
- Checkout step completion: Long forms, limited payment options, and poor mobile UX are the primary culprits.
| Funnel stage | Common friction cause | Diagnostic tool |
|---|---|---|
| Landing to product page | Weak value proposition, slow load | Google Analytics 4, PageSpeed Insights |
| Product page to cart | Poor imagery, missing reviews | Hotjar heatmaps, session recordings |
| Cart to checkout | Unexpected costs, no guest checkout | Funnel reports, exit surveys |
| Checkout completion | Long forms, limited payment methods | Microsoft Clarity, form analytics |
Pro Tip: Avoid building funnels that are too long. Funnels with more than six steps become difficult to maintain and obscure where the real problem lies. Keep them tight and revisit definitions quarterly.
What tools and frameworks help prioritise hypotheses?
Prioritisation separates high-performing CRO teams from those who test randomly and wonder why results are inconsistent. Two frameworks dominate in practice.
ICE scoring rates each hypothesis by Impact (how much will it move the needle?), Confidence (how strong is the evidence?), and Ease (how much effort does it require?). EPIC scoring extends this with Experiment value and Priority weighting. Both frameworks help teams focus resource on high-impact hypotheses rather than chasing the most visually obvious changes.
Here is how the most widely used CRO tools compare by function:
| Tool | Primary use | Best for |
|---|---|---|
| Google Analytics 4 | Quantitative funnel data | Drop-off analysis, segment reporting |
| Hotjar | Heatmaps, session recordings | Qualitative friction identification |
| VWO | A/B and multivariate testing | Test execution and result analysis |
| Microsoft Clarity | Free session recording | Budget-conscious teams, quick audits |
For testing methodology, A/B testing with one control and one variation is preferred over multivariate testing unless your traffic volumes are exceptionally high. Multivariate tests require significantly more traffic to reach significance and produce results that are harder to interpret clearly. Stick to A/B for most e-commerce scenarios.
When setting up tests, follow this sequence:
- Calculate the minimum sample size required using a tool like Evan Miller’s sample size calculator before launching.
- Set your traffic split. Use 50/50 for standard tests. Use a 10% ramp-up for changes that carry commercial risk, such as checkout flow alterations.
- QA every variant across Chrome, Safari, Firefox, and both desktop and mobile. A variation that works on desktop Chrome can break on mobile Safari, causing lost conversions and wasted test traffic.
- Document the hypothesis, expected outcome, and success metric before the test goes live.
How to analyse and interpret testing results
Reaching statistical significance is necessary but not sufficient. The real work in result analysis is understanding what the result means for your business, not just whether the variant won.
The core rules for sound result analysis are:
- Wait for 95% confidence and a full business cycle. Prematurely calling winners leads to gains that disappear post-implementation. One in seven A/B tests produces a statistically significant winner, so patience is not optional.
- Analyse the full funnel impact. A variant that improves click-through rate on a product page but reduces add-to-cart rate has not won. Measure downstream.
- Segment your results. A test that shows neutral results overall may be hiding a strong win on desktop and a significant loss on mobile. Segmenting by device, traffic source, and user type surfaces these hidden patterns.
- Monitor guardrail metrics. Track average order value and lead quality alongside conversion rate. A higher conversion rate that reduces average order value can be a net negative for revenue.
Pro Tip: Build a shared test log in Notion or Confluence. Record the hypothesis, result, segments analysed, and the learning. This repository becomes one of the most valuable assets your CRO team owns, especially when onboarding new team members.
Document every result, including losses. Failed tests tell you what your audience does not respond to, which is just as strategically useful as knowing what works. A well-maintained CRO checklist keeps this process consistent across campaigns and team members.
How to scale winning optimisations and maintain momentum
Deploying a winning variant is not the end of the process. It is the beginning of the next cycle. A true CRO workflow is a continuous, looping system where each completed test raises the baseline for subsequent tests, producing compounding improvements over time.
Follow these steps when scaling a winning test:
- Deploy with technical validation. Work with your development team to implement the winning variant exactly as tested. Any deviation in implementation risks breaking the tracking that proved it worked.
- Establish a new baseline. Once deployed, allow two to four weeks of post-launch data to accumulate before treating the new conversion rate as your baseline for future tests.
- Revisit funnel definitions. A change to the checkout flow may alter how users move through earlier funnel stages. Update your funnel mapping to reflect the new reality.
- Audit data integrity quarterly. Tracking configurations degrade over time as platforms update, third-party scripts change, and new features are added. A quarterly e-commerce analytics review catches drift before it corrupts your next round of tests.
- Feed learnings back into the hypothesis backlog. Every result, win or loss, generates insight that should inform the next set of test ideas. This is what separates teams that plateau from those that compound.
The most common scaling mistake is treating CRO as a project with a finish line. There is no finish line. User behaviour shifts, product catalogues change, traffic sources evolve, and seasonal patterns alter conversion dynamics. The teams that win long-term are those that treat optimisation as an ongoing system, not a one-off sprint.
Key takeaways
A conversion optimisation workflow delivers compounding gains only when data integrity, disciplined testing, and continuous iteration are treated as non-negotiable foundations.
| Point | Details |
|---|---|
| Audit before optimising | Validate analytics accuracy before any test, as flawed data produces misleading results. |
| Funnel analysis drives focus | Drop-offs from landing page to product page can reach 40 to 60%, making this the highest-priority area. |
| Prioritise with frameworks | Use ICE or EPIC scoring to rank hypotheses by impact and effort before committing resource. |
| Wait for true significance | Reach 95% confidence and complete a full business cycle before declaring any test a winner. |
| Treat CRO as a system | Each winning test raises the baseline for the next, creating compounding conversion improvements over time. |
Where most e-commerce teams go wrong with CRO
I have worked with enough e-commerce teams to spot the pattern quickly. The problem is almost never a lack of test ideas. It is a lack of trust in the data underpinning those ideas.
Teams rush to test button colours and headline copy while their Google Analytics 4 setup is firing duplicate events and attributing 30% of revenue to direct traffic because UTM parameters are stripping on redirect. You cannot build a reliable conversion rate strategy on a broken foundation. The audit phase is not a formality. It is the most important thing you do.
The second mistake I see consistently is impatience with results. A test goes live, it shows a 15% uplift after five days, and someone in a meeting declares it a winner. Three weeks later, post-implementation, the uplift has vanished. This is not bad luck. It is the predictable consequence of ignoring statistical discipline.
The teams I respect most treat their A/B testing workflow like a scientific process, not a creative exercise. They document everything, segment every result, and resist the pressure to call winners early. They also accept that most tests will not produce significant results, and they are fine with that, because each one still teaches them something about their customers.
Patience and discipline compound. The teams running two to four tests per month with rigorous analysis will outperform the teams running one test per quarter with loose methodology every single time.
— Steve
How Bigeyedeers can support your CRO workflow

At Bigeyedeers, we work with e-commerce managers and marketing teams who know their conversion rates should be higher but are not sure where the process is breaking down. As a Magento and Shopify agency with over 17 years of experience, we bring together technical expertise and commercial understanding to build CRO workflows that are grounded in clean data and disciplined testing. From analytics audits and Figma-led UX reviews to Klaviyo lifecycle marketing and Klevu-powered product discovery, we connect every layer of your e-commerce platform to your conversion goals. If you want a structured, evidence-based approach to improving website conversion, we would be glad to talk through where to start.
FAQ
What is a conversion optimisation workflow?
A conversion optimisation workflow is a repeatable, data-driven process for systematically improving the percentage of website visitors who complete a desired action. It typically covers analytics auditing, funnel mapping, hypothesis building, A/B testing, result analysis, and scaling.
How long should an A/B test run before I analyse results?
A test should run until it reaches 95% statistical confidence and completes at least one full business cycle, typically two to four weeks for most e-commerce stores. Ending tests early is one of the most common causes of false positives in CRO.
Where do most e-commerce conversion drop-offs occur?
Drop-offs most commonly occur at the top of the funnel, particularly between the landing page and product page, where rates can reach 40 to 60%. Weak value propositions and slow load times are the primary causes at this stage.
What is the difference between ICE and EPIC scoring?
ICE scores hypotheses by Impact, Confidence, and Ease. EPIC extends this with Experiment value and Priority weighting. Both frameworks help CRO teams rank test ideas and allocate resource to the highest-potential opportunities first.
How often should we audit our analytics setup?
A full analytics audit should be conducted at least quarterly. Tracking configurations degrade as platforms update and new features are added, and undetected errors will corrupt the data that your entire conversion rate strategy depends on.
Recommended


Adobe Commerce (Magento)
Formerly known as Magento, Adobe Commerce is built for complex catalogues, integrations, and long term growth. We design and develop stable, scalable stores that support demanding eCommerce requirements, including multi-store setups, complex pricing, and Hyva based performance improvements.

Bespoke Build
We design and build custom eCommerce platforms for businesses with complex workflows, integrations, or non standard requirements. Built from scratch around your business needs using Laravel and modern architectures.

Working with brands across the UK from our offices in Cardiff and Exeter, you deal directly with a senior team of designers and developers specialising in Shopify, Magento, WordPress and bespoke eCommerce platforms.
We focus on commercial outcomes. Better conversion rates, strong SEO foundations and eCommerce platforms that continue to improve long after launch.