User journey mapping process: a practical guide
TL;DR:
- User journey mapping visually captures a customer’s experience with a product or service, guiding improvements. It relies on real user data and collaboration to identify friction points and opportunities. Regular updates and clear ownership turn the map into an effective decision-making tool.
The user journey mapping process is a structured, visual method for capturing the complete experience a customer has with a product or service over time. Also known as customer journey mapping, it transforms abstract interactions into clear, prioritised insights that teams can act on. Companies with formal journey management programmes see 54% greater return on marketing investment year over year. That figure alone tells you this is not a design exercise. It is a commercial decision tool. At Bigeyedeers, we use Figma to plan user journeys and wireframes before any development begins, because the map shapes every decision that follows.
What does the user journey mapping process actually involve?
A user journey map is a visual document that plots a specific persona moving through a defined scenario, stage by stage. Each stage captures what the user does, thinks, and feels at that moment. The Nielsen Norman Group defines the core components as: actor (persona), scenario, journey stages, actions, emotions, touchpoints, and opportunities. Get these wrong and the map becomes decoration.

The most critical input is real user data. The biggest mistake teams make is building maps from internal assumptions rather than actual research. Assumptions feel faster, but they produce maps that reflect what your team believes rather than what your customers experience.
Reliable data sources include:
- User interviews conducted with open questions about goals and frustrations
- Session replays that show where users hesitate, scroll back, or abandon
- Support tickets and live chat logs that surface recurring pain points in the customer’s own words
- Analytics funnels that reveal drop-off rates at specific steps
- Heatmaps that show where attention concentrates or disappears
Experts recommend keeping journey stages between 4 and 7 to maintain clarity. More than seven stages and the map becomes a process diagram. Fewer than four and it loses the narrative detail needed to identify friction.
The emotional arc is the layer most teams underinvest in. Plotting emotional highs and lows along the journey reveals trust leaks and is usually where revenue impact is greatest. A user who feels confused at checkout does not just abandon that session. They often do not return.
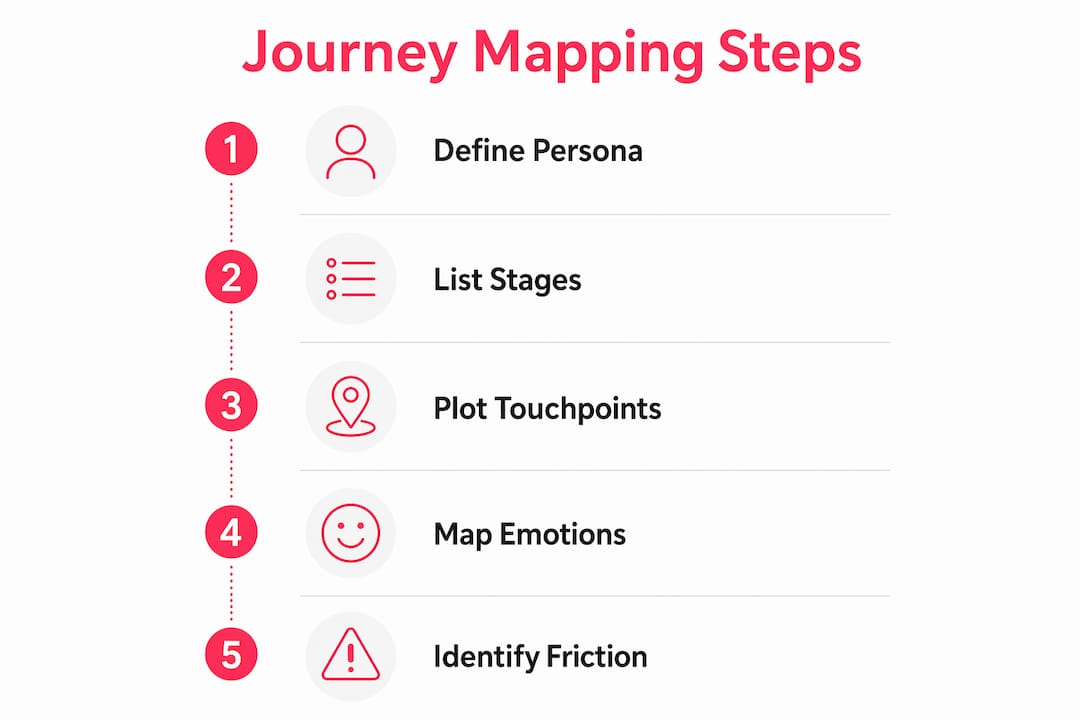
Pro Tip: Keep your map narrative-driven. If a colleague cannot identify the critical friction point within five seconds of looking at it, the map is too complex. Simplify the story before adding more data layers.
How do you run an effective journey mapping workshop?
A collaborative workshop is the most reliable way to build a journey map that teams will actually use. Approximately 64% of product teams conduct journey mapping in cross-functional groups rather than individually. Shared ownership is the reason. When a developer, a customer service manager, and a marketing lead all contribute to the same map, they each leave with a stake in fixing what it reveals.
A well-run workshop follows this sequence:
- Set scope and persona. Agree on the specific user type and scenario before the session begins. Scope creep mid-workshop wastes time and dilutes the output.
- Individual input via sticky notes. Each participant writes down every step they believe the user takes. This surfaces assumptions before they become consensus.
- Rebuild the timeline together. The group arranges sticky notes into a shared sequence, debating the order and identifying gaps.
- Annotate emotions and states. Participants rate the emotional experience at each stage, using a simple scale from frustrated to delighted.
- Mark friction points. The group flags moments where the user is most likely to struggle, hesitate, or leave.
- Prioritise opportunities. Each friction point is assessed for frequency, severity, and potential business impact before the session closes.
Collaborative mapping surfaces disagreements that would otherwise stay hidden in silos. That is not a side effect. It is the point.
| Workshop role | Responsibility | Typical time commitment |
|---|---|---|
| Facilitator | Manages scope, pace, and assumptions | Full session (3–4 hours) |
| UX researcher | Presents user data and validates claims | Full session |
| Product owner | Prioritises opportunities and owns outcomes | Full session |
| Developer | Flags technical constraints at friction points | 1–2 hours |
| Customer service lead | Contributes support data and real user language | 1–2 hours |
Label every sticky note with a confidence level: “confirmed by research,” “team assumption,” or “needs validation.” This prevents assumptions from hardening into facts during the session.
What tools and techniques speed up journey mapping in 2026?
The gap between a rough workshop output and a polished, usable map used to take weeks. Modern 2026 workflows use AI-moderated voice interviews and real session data to capture emotional language, reducing map creation time from months to days. That shift changes what is possible for teams without a dedicated research function.
The practical gains come from several directions:
- AI-moderated interviews that prompt users with follow-up questions in real time, capturing verbatim emotional language without a researcher in the room
- Automatic thematic coding that groups interview responses by sentiment and topic, cutting manual analysis from days to hours
- Session replay integration that links specific map stages to recorded user behaviour, replacing guesswork with evidence
- Live map platforms that update automatically as new data arrives, keeping the map current rather than frozen at the point of creation
At Bigeyedeers, we use Figma as our primary environment for planning user journeys and interface systems. It keeps the map visible to the whole team throughout development, not just at the start of a project. AI tools complement this by accelerating the research phase, but they do not replace the judgement needed to interpret what the data means for a specific business context.
Pro Tip: Always validate AI-generated themes against raw user quotes before presenting findings. Automated coding can miss irony, context, and the specific frustration that turns out to be your biggest conversion problem.
Practitioners validate assumptions using session replays, support tickets, and heatmaps before finalising any map, marking confidence levels for full transparency. This belt-and-braces approach keeps the map honest and prevents the team from acting on data that has not been properly verified.
How do you turn a journey map into a decision-making tool?
A journey map that sits in a shared drive and gets referenced once a quarter is shelfware. Assigning ownership and measurable check-in dates for each pain point is what separates maps that drive change from maps that gather dust.
Score each pain point across three dimensions: frequency (how often users encounter it), severity (how badly it disrupts the experience), and revenue impact (what it costs the business in lost conversions or increased support load). Quantitative scoring removes the politics from prioritisation. The highest-scoring issues get an owner and a resolution date. Everything else joins a backlog.
Frame opportunities as “How might we” questions rather than prescriptive solutions. “How might we reduce the time a user spends finding their size?” is more useful than “Add a size guide.” The question preserves creative freedom during design. The instruction closes it down before the problem is fully understood.
Effective journey maps act as decision models that highlight gaps between customer expectations and reality. That framing matters because it positions the map as an ongoing reference, not a one-time deliverable.
| Common pitfall | Effective alternative |
|---|---|
| Map built from team assumptions | Ground every stage in user interviews and session data |
| No owner assigned to pain points | Each friction point has a named owner and a review date |
| Map updated once and archived | Reviewed after every major product release or data refresh |
| Opportunities written as solutions | Framed as “How might we” questions to preserve design options |
| Too many stages, too much data | Limit to 4–7 stages with a clear narrative thread |
Review and update the map whenever a significant product change ships, when new analytics data reveals a shift in user behaviour, or when support ticket volumes spike around a specific stage. A living map is a useful map. A static one is a historical document.
For ecommerce teams, the user experience impact of acting on journey map findings is direct and measurable. Fixing a checkout friction point identified in a map translates immediately into conversion rate data.
Key takeaways
The user journey mapping process delivers commercial results only when it combines real user data, cross-functional collaboration, and clear ownership of every identified pain point.
| Point | Details |
|---|---|
| Ground maps in real data | Use interviews, session replays, and support logs rather than internal assumptions. |
| Keep stages between 4 and 7 | More stages create complexity that hides friction rather than revealing it. |
| Map collaboratively | Cross-functional workshops surface disagreements and build shared ownership of outcomes. |
| Score and assign pain points | Prioritise by frequency, severity, and revenue impact, then assign a named owner and review date. |
| Treat the map as a living document | Review after every major release or data shift to keep insights current and relevant. |
What I have learned from years of journey mapping in ecommerce
The maps that actually change things are rarely the most detailed ones. I have seen beautifully produced journey maps with twelve stages, colour-coded emotion curves, and annotated touchpoints for every channel. They looked impressive in a presentation. Six months later, nothing had changed. The team could not agree on where to start.
The maps that drove real decisions were simpler. Four or five stages, a clear emotional arc, and three friction points with owners attached before the workshop ended. The narrative-driven approach is not a compromise. It is the point. A map that a developer, a marketer, and a CEO can all read in thirty seconds is a map that gets used.
The other mistake I see constantly is assumption-led mapping dressed up as research. Teams conduct one round of user interviews, hear what they expected to hear, and build a map that confirms their existing roadmap. Real mapping means sitting with data that contradicts your assumptions and building the map around what users actually do, not what you hoped they would do.
Cross-team collaboration is genuinely uncomfortable the first time. A customer service lead will say something that surprises the product team. A developer will flag a technical constraint that invalidates a proposed fix. That friction is the value. The map is the mechanism for having those conversations in a structured way rather than in a post-launch retrospective.
Keep the map alive. Set a calendar reminder to review it after every significant release. Attach it to your product roadmap so that new features are evaluated against the journey before they are built. A map that is updated quarterly is worth ten times more than one that was perfect on the day it was created.
— Steve
How Bigeyedeers can help you act on your journey mapping insights
Journey mapping reveals where your ecommerce experience is losing customers. Acting on those findings requires design and development capability that can move quickly and build correctly.
Bigeyedeers is a UK-based Magento and Shopify agency with over 17 years of experience building high-performing online stores. We use Figma to plan user journeys and wireframes before development begins, so every build reflects what your customers actually need. Whether you are running a Magento Open Source store, an Adobe Commerce build, or a Shopify setup, we translate journey map insights into ecommerce UX improvements that show up in your conversion data. Get in touch to talk through what your journey map is telling you.
FAQ
What is the user journey mapping process?
The user journey mapping process is a structured method for visualising the complete experience a customer has with a product or service, stage by stage. It captures actions, emotions, and touchpoints to identify friction and prioritise improvements.
How many stages should a user journey map have?
Experts recommend between 4 and 7 stages. Fewer than four loses narrative detail; more than seven creates complexity that obscures the friction points you need to act on.
What data sources should I use for journey mapping?
Use user interviews, session replays, support ticket logs, analytics funnels, and heatmaps. Maps built from internal assumptions rather than real user data are the most common cause of ineffective journey mapping.
How do I stop a journey map becoming shelfware?
Assign a named owner and a measurable review date to every pain point identified in the map. Without ownership, maps are never acted upon. Review the map after every major product release or significant shift in user behaviour.
How long does it take to create a journey map in 2026?
Modern AI-moderated workflows and session data integration have reduced map creation time from months to days for teams with access to existing user research. A well-facilitated workshop can produce a usable draft map in a single three to four-hour session.
Recommended



Adobe Commerce (Magento)
Formerly known as Magento, Adobe Commerce is built for complex catalogues, integrations, and long term growth. We design and develop stable, scalable stores that support demanding eCommerce requirements, including multi-store setups, complex pricing, and Hyva based performance improvements.

Bespoke Build
We design and build custom eCommerce platforms for businesses with complex workflows, integrations, or non standard requirements. Built from scratch around your business needs using Laravel and modern architectures.
Working with brands across the UK from our offices in Cardiff and Exeter, you deal directly with a senior team of designers and developers specialising in Shopify, Magento, WordPress and bespoke eCommerce platforms.
We focus on commercial outcomes. Better conversion rates, strong SEO foundations and eCommerce platforms that continue to improve long after launch.